

You paste the same primer into two online tools and get two different melting temperatures. It is a moment most bench scientists have had, usually followed by a flicker of doubt about which number to trust. The good news is that the mismatch is normal. This article explains what melting temperature really is, why predictions vary, and how to choose a sensible annealing temperature anyway.
What Is Melting Temperature?
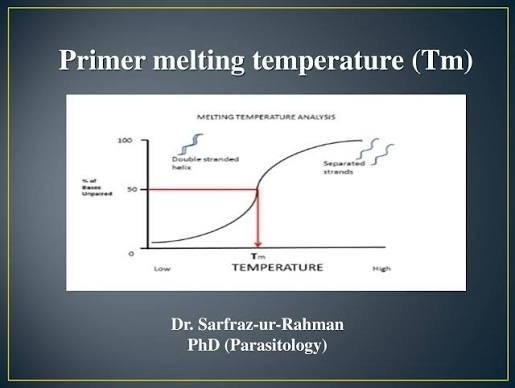
Melting temperature (Tm) is the point at which roughly half of a primer is bound to its complementary strand and half is single-stranded. It sounds like a fixed property of the sequence, but it is actually a prediction. The same primer can have different Tm values depending on the conditions in the tube.
The Main Factors Behind Tm
Primer Length and GC Content
Longer primers and those rich in G and C bases bind more tightly, because G-C pairs form three hydrogen bonds while A-T pairs form two. This is why most design guides suggest a GC content of roughly 40 to 60 percent.
Salt and Magnesium
Positive ions shield the negatively charged DNA backbone and stabilize the duplex. More sodium, potassium, or magnesium generally pushes Tm up. Free magnesium is also affected by dNTPs, which bind it, so the balance of these components matters.
Primer Concentration
A higher primer concentration favors the bound state and raises the predicted Tm slightly. If two calculators start with different default concentrations, their answers diverge immediately.
Additives and Mismatches
DMSO and betaine loosen base pairing and lower Tm. A mismatch between primer and template does the same. Many calculators ignore these unless you enter them.
Why Calculators Disagree
Different tools make different assumptions. Understanding why NEB and IDT Tm values differ comes down to a few points that apply to nearly any pair of calculators:
- Different buffer assumptions. One tool may model a specific polymerase buffer while another uses low-salt defaults.
- Different methods. Simple formulas use only length and GC count, while nearest-neighbor models consider every adjacent base pair.
- Different outputs. Some tools report a plain Tm, others suggest an annealing temperature for a specific enzyme.
- Different starting values. Concentration and ion settings may not match.
Tm Is Not the Same as Annealing Temperature
This is the most common mix-up. Tm describes the primer under stated conditions. Annealing temperature (Ta) is what you program into the thermocycler. The gap between them depends on the polymerase. Comparing one tool’s Ta with another tool’s Tm will never line up, and nothing is broken.
How to Compare Tools Fairly
- Paste the identical primer sequence into each tool, with no spaces or labels.
- Set the same primer concentration in both.
- Enter ion and dNTP values close to your real reaction buffer.
- Compare Tm with Tm and Ta with Ta.
- Confirm the result with a gradient PCR.
Practical Rules for Primer Pairs
- Use one tool for both primers. Mixing numbers from different tools makes the Tm difference meaningless.
- Keep the pair close. Aim for primers within about 2 degrees of each other, and avoid gaps beyond 5 degrees.
- Check the 3′ end. A G or C near the end helps the polymerase begin extension, but too many in a row can cause mispriming.
- Do not average two tools. A blended value matches neither model.
- Record your settings. Note the tool, enzyme, concentration, and ion values beside each Tm.
When Results Do Not Behave
If you see faint bands, smears, or no product, the annealing temperature is a good first suspect. Too high and primers cannot bind. Too low and they bind non-specifically. Run a gradient across a range around the predicted value and pick the highest temperature that still gives a clean, single band.
Final Thoughts
A calculated Tm is a well-informed starting point, not a final answer. Choose the tool that best matches your actual chemistry, apply it consistently, and let a gradient PCR make the final decision. Once you understand what each number represents, the disagreement between tools stops being confusing and starts being useful information.